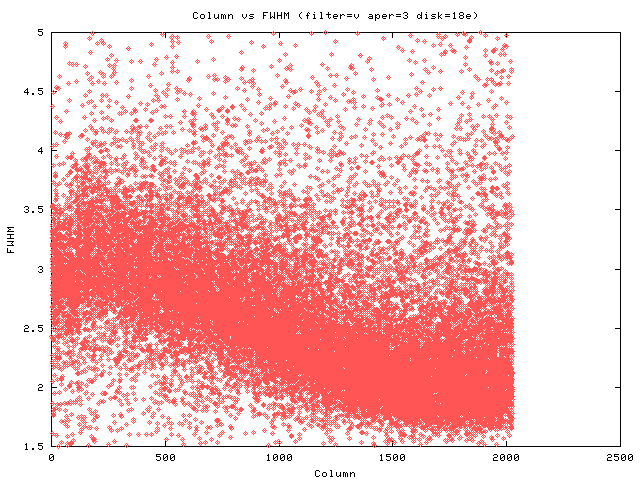
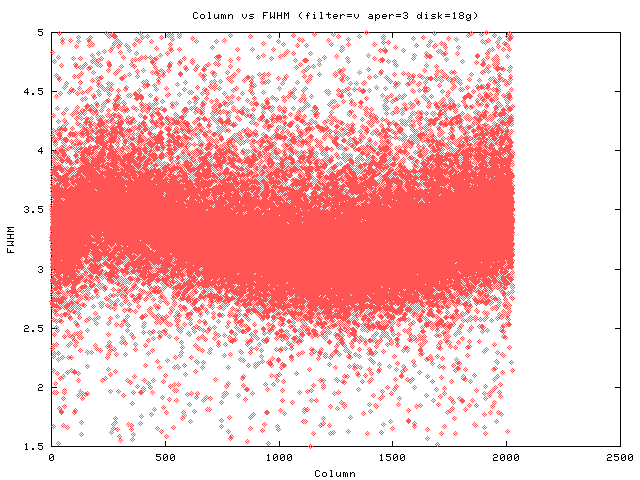
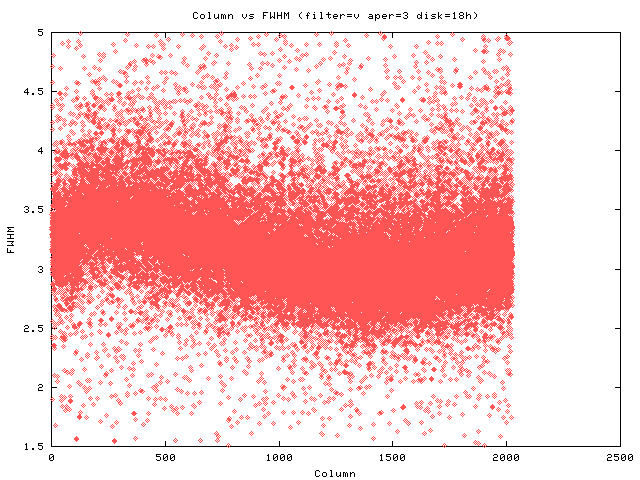
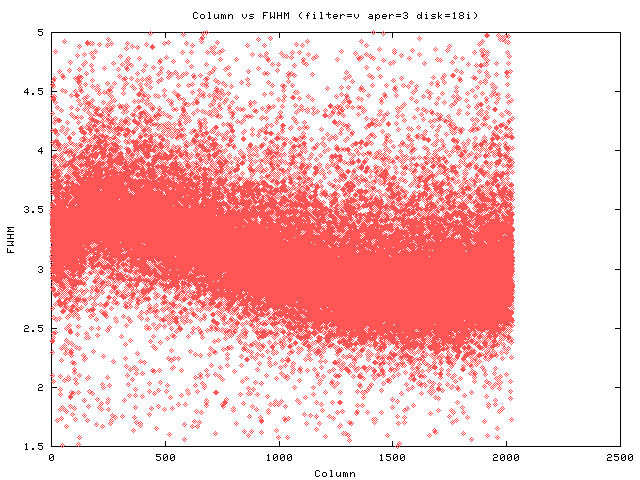
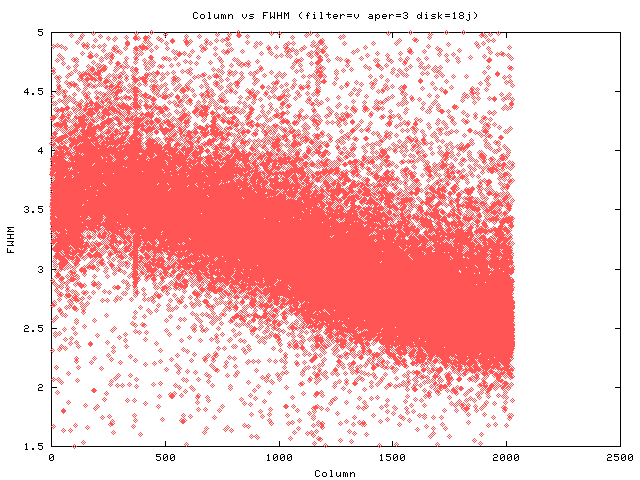
V Filter Column fwhm plots for several nights
As you can see in the V plots the slope changes quite a bit. disks B-E are quite similar, G is much flatter and the slope decreases over HIJ
What changed between E(F??) and G disks?
Tom writes on README on 18J
"I changed a camera mid way in the run, so you will not be able to use one flat for the whole run."
So that might explain things a bit. Presumably it was the V camera.
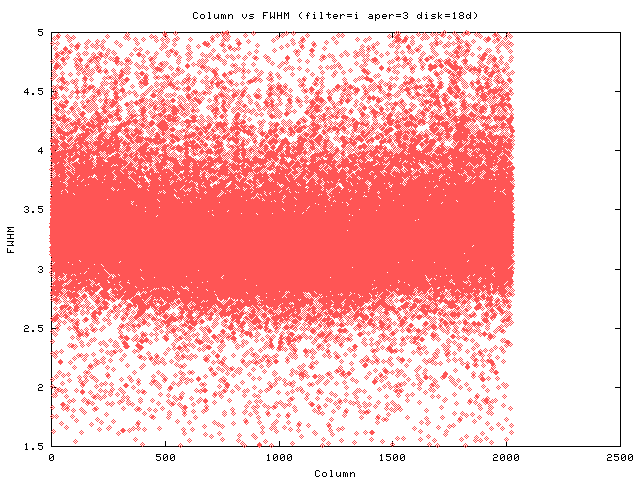
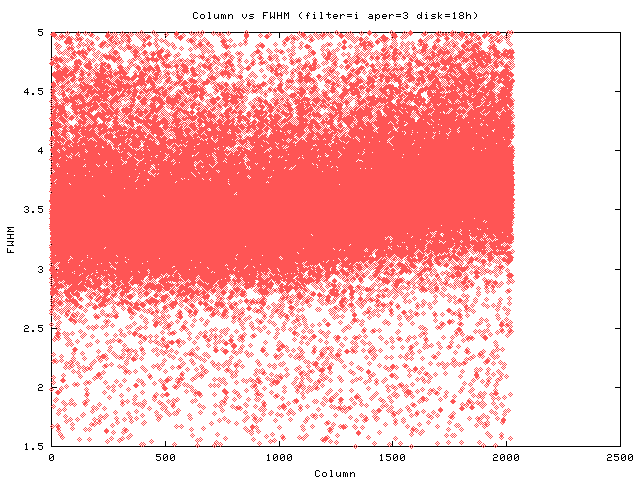
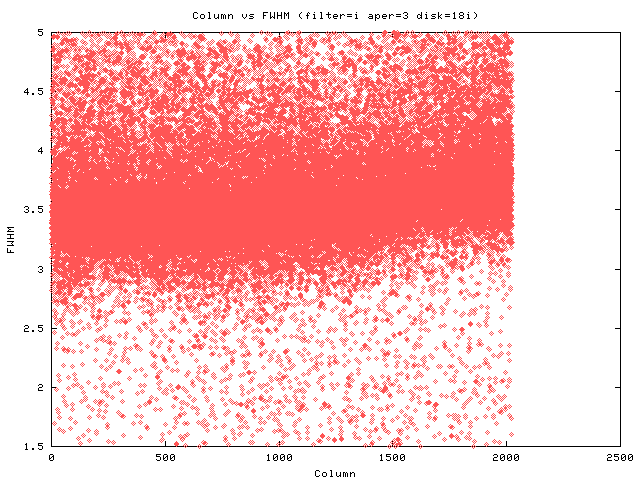
I Filter Column fwhm plots for several nights
The I fwhm column plots have two similar forms B-E and G-J.